Set Up Distributed Tracing
Learn how to connect events across applications/services.
If the overall application landscape that you want to observe with Sentry consists of more than just a single service or application, distributed tracing can add a lot of value.
Distributed tracing connects and records the path of requests as they travel through your distributed system, creating a comprehensive timeline of events that would otherwise be fragmented across different components.
This end-to-end visibility allows developers to identify bottlenecks, pinpoint the root cause of errors, and understand component interactions—turning what would be a complex debugging nightmare into a manageable process that improves system reliability and performance.
Here's an example showing a distributed trace in Sentry:
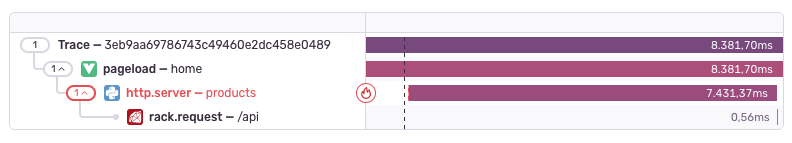
This distributed trace shows a Vue app's pageload making a request to a Python backend, which then calls the /api endpoint of a Ruby microservice.
What happens in the background is that Sentry uses reads and further propagates two HTTP headers between your applications:
sentry-tracebaggage
If you run any JavaScript applications in your distributed system, make sure that those two headers are added to your CORS allowlist and won't be blocked or stripped by your proxy servers, gateways, or firewalls.
In version 8.0.0 and above of the Sentry Node SDK, distributed tracing will work out of the box.
Sentry.init({
dsn: "https://examplePublicKey@o0.ingest.sentry.io/0",
tracesSampleRate: 1,
});
If you don't want to use tracing, you can set up Custom Instrumentation for distributed tracing.
If you want to disable distributed tracing and ensure no Sentry trace headers are sent, you can configure your SDK like this:
Sentry.init({
dsn: "https://examplePublicKey@o0.ingest.sentry.io/0",
// Overwrite the defaults to ensure no trace headers are sent
tracePropagationTargets: [],
});
Remember that in order to propagate trace information through your whole distributed system, you have to use Sentry in all of the involved services and applications. Take a look at the respective SDK documentation to learn how distributed tracing can be enabled for each platform.
Server-side SDKs handle traces automatically on a per-request basis. This means that SDKs will:
- Continue an existing trace if the incoming request contains a trace header.
- Start a new trace if the incoming request does not contain a trace header. This trace stays active until the response is sent.
If necessary, you can override the default trace duration by manually starting a new trace.
Our documentation is open source and available on GitHub. Your contributions are welcome, whether fixing a typo (drat!) or suggesting an update ("yeah, this would be better").